Artificial intelligence is no longer an exclusive resource for large corporations—it has become a key enabler of growth at any business scale. What once sounded futuristic is now within reach for startups and SMEs seeking to compete in increasingly dynamic markets. Within this landscape, one of the most promising innovations is agentic AI, a technology that doesn’t just execute commands but reasons, decides, and acts autonomously.
The term might sound technical, but the idea is simple: while traditional AI solutions work like assistants that wait for instructions, agentic AI becomes an independent collaborator that understands context, learns from experience, and makes decisions aligned with your business objectives. For a small company, this means saving time on repetitive tasks, responding better to customers, and making faster, data-driven decisions.
What agentic AI means for an SME
Automation has always been seen as a path to boosting workplace efficiency. However, it has often been limited to rigid workflow programming, chatbots with predetermined responses, or management systems that only work within fixed parameters. Agentic AI breaks that barrier: it doesn’t just obey—it interprets and adapts.
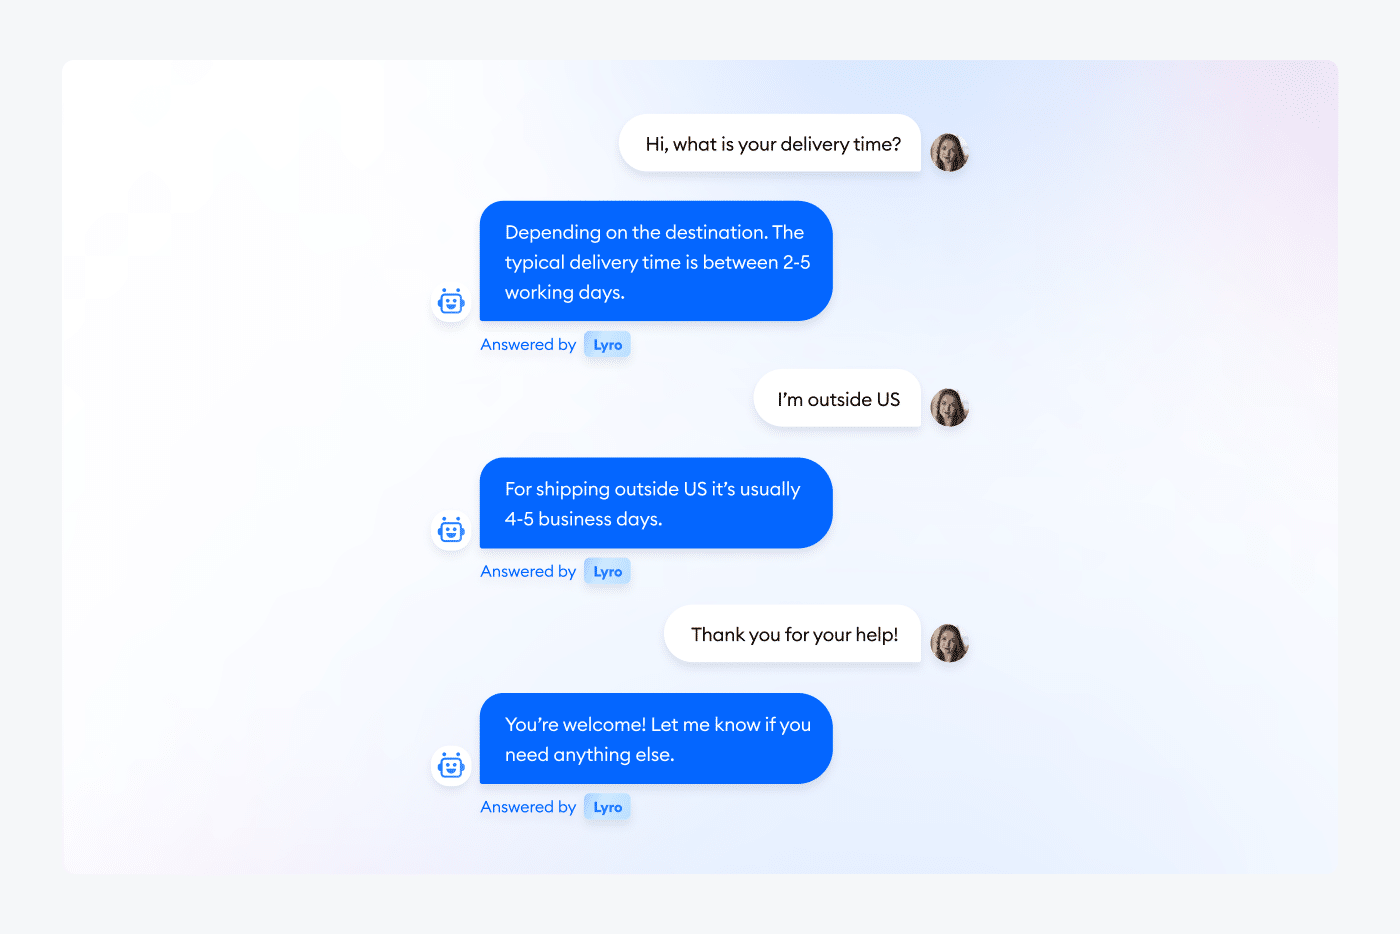
Take a simple example. A traditional chatbot answers FAQs but fails when faced with off-script requests. An AI agent, on the other hand, remembers past interactions, understands the customer’s history, and can even anticipate what that person might need. If someone repeatedly checks the price of a service, the AI doesn’t just reply—it can suggest scheduling a sales call or automatically send a personalized proposal.
The impact goes far beyond sales. Agentic AI can organize invoices, filter emails, identify inventory trends, or prioritize business opportunities. For small businesses, often operating with limited resources and lean teams, having this type of support can mean the difference between stagnation and growth.
How intelligent automation transforms operations
One of the most appealing aspects of agentic AI is its ability to operate independently, without constant human supervision. This frees teams from routine tasks and allows them to focus on higher-value, strategic activities.
Some of the most relevant benefits for SMEs include:
-
Always-on customer service: digital agents available 24/7 that not only respond but learn from customer tone and questions to deliver personalized solutions.
-
Faster commercial processes: identification of potential customers based on behavior, lead prioritization, and automated follow-ups.
-
Real-time data analysis: instead of waiting for weekly or monthly reports, AI agents can instantly detect consumption patterns or stock issues.
-
Frictionless scalability: the technology grows with the business, adapting to demand peaks or an expanding client base without immediately hiring extra staff.
In other words, agentic AI doesn’t replace teams—it becomes a strategic partner that multiplies their capabilities.

Real applications in small businesses
To better understand the value of agentic AI, let’s ground it in concrete scenarios:
-
Automated marketing: AI agents monitor campaigns, adjust budgets, and predict the best times to publish on social media—making every marketing dollar work harder.
-
Smart sales: if a client visits the pricing page multiple times, AI flags them as a hot lead and automatically books a meeting with a sales rep.
-
Customer support: a digital agent can handle basic questions about hours, policies, or products and escalate sensitive cases to a human team.
-
E-commerce shopping assistants: they remember customer preferences and suggest relevant products, improving the shopping experience and boosting average order value.
These applications aren’t futuristic—they already exist in accessible tools that let SMEs start small and scale gradually.
How to get started
The process of adopting agentic AI can be broken into simple phases:
-
Identify pain points: start with time-consuming, low-value tasks like repetitive inquiries or database updates.
-
Choose the right tools: you don’t need a massive investment. There are AI solutions designed for SMEs that integrate with existing CRMs or POS systems.
-
Run a pilot project: begin with something manageable, such as a chatbot for FAQs. This validates results without major risks.
-
Train the agent: outcomes depend on the quality of input data. Feed the system customer info, product details, and past interactions.
-
Measure and improve continuously: track performance and adjust responses or workflows as the AI learns about your business.
The key is to start small, validate results, and expand functions strategically.
Common challenges and how to overcome them
Of course, every innovation comes with obstacles. The most common when implementing agentic AI in small businesses are:
-
Learning curve: it may feel complex at first. Rely on tutorials, vendor support, and gradual training.
-
Data security: a valid concern. The solution is choosing platforms that guarantee encryption, transparency, and regulatory compliance.
-
Fear of losing the human touch: automation doesn’t mean dehumanization. Use AI for repetitive tasks, reserving humans for emotional and strategic interactions.
-
Tight budgets: many SMEs worry about costs, but today there are affordable options built into CRM systems with no hidden fees or heavy upfront investments.
Each challenge has a solution, and the balance of effort versus benefit clearly favors adoption.
A long-term growth tool
More than a trend, agentic AI represents a new paradigm in business management. For small companies, it can become a true growth driver, freeing time, reducing costs, and improving customer experience.
Its most compelling aspect is continuous learning: the more it interacts, the more precise it becomes. This means your automation investment doesn’t stagnate—it improves over time, something traditional processes rarely achieve.
The real question is no longer whether small businesses can afford to implement agentic AI, but whether they can afford not to—when automation and AI are setting the pace of the market.
Conclusion
Agentic AI is here to stay. Its ability to act independently, learn from every interaction, and adapt to market changes makes it one of the most powerful tools SMEs can adopt today.
Implementing it doesn’t require tech expertise or big budgets. All it takes is identifying repetitive tasks, launching a pilot, and letting automation do the rest.
If your goal is to enhance workplace efficiency, increase sales, and secure long-term business growth, agentic AI is the partner you’ve been waiting for. The next strategic decision for your company won’t be taken alone—you’ll take it with the help of artificial intelligence.


